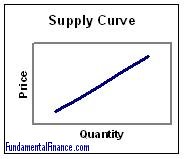
The Supply Curve
The first law of supply states that as the price of a product increases the quantity supplied will increase. This relationship yeilds the supply curve, a fundamental notion of economics.
The concept underlying the supply curve is the increasing marginal costs faced by industries and firms.
Marginal cost is the cost of an additional unit. We could also look at the average marginal cost of 10,000 additional units. At higher scales we can look at whole industries and determine the marginal cost of 1,000,000 more units, which might be the cost of building additional factories or establishing additional firms. Mathematically:
MC = ĀChange in TC / Change in Q
There are many factors that can cause increasing marginal costs. Scarce natural resources might be easy to gather at first, but become much harder as more people collect them (think of the California Gold Rush or of too many people fishing in one lake). The need to hire additional management or manage additional people can cause more inefficiencies. Limited space can become a burden. The need to advertise because of increased competition may reign in additional costs. Changing capital to labor ratios can also change marginal cost.
Imagine an investor who decides to start a bread bakery. First he purchases the building and all of the machinery. These are his fixed costs. In order to start producing bread, he must buy flour to put into his machinery and he also must hire a baker. These are the resources he needs. The marginal cost of bread is the cost to make each additional loaf. At first it's relatively cheap--the investor has already purchased the machinery and the building, now he just pays a few cents for flour and a minimal amount to the baker for time spent on the first few loaves. As production of loaves rises, the baker will be working efficiently for 40 hours a week. The investor can continue to increase production by buying more flour and hiring more bakers. Perhaps two bakers can work more efficiently together than one could have alone, but eventually if too many bakers are hired the bakers will start bumping into each other and won't be able to all use the machinery simultaneously. This causes them to work less efficiently than the original one or two bakers. This means that the cost to produce additional loaves has increased from what it was before--the marginal cost of the loaves have increased.
Below I have plugged in some numbers to create a supply schedule for the bakery. Assume that flour for each loaf costs $.50 and bakers cost $50/day. Also assume the amount of flour used is directly proportional to the amount of loaves made.
| # of Bakers | # of Loaves | Total Cost | Avg. Cost/Loaf | Marg. Cost/Loaf |
|---|
| 1 | 100 | $100 | $1.00 | $1.00 |
| 2 | 220 | $210 | $0.95 | $0.92 |
| 3 | 310 | $305 | $0.98 | $1.06 |
| 5 | 430 | $465 | $1.08 | $1.33 |
| 10 | 600 | $800 | $1.33 | $1.97 |
Now let's graph the number of loaves vs. the marginal cost. You'll notice it looks like a supply curve.
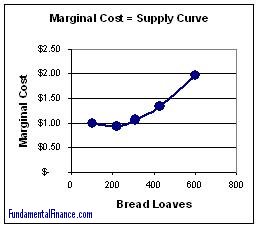
This graph shows marginal cost on the y-axis, but the supply curve has price on the y-axis. It makes sense that the investor in the bakery example would only be willing to make more bread if the price was equal to or greater than the marginal cost to make that bread. Thus by simply substituting price for marginal cost we can get an idea of what the bakery would supply at a given market price. If the going market price of bread were $1.33/loaf, the investor would hire 5 bakers and make 430 loaves. If the price were $2.00/loaf the investor would hire 10 bakers and produce 600 loaves.
That is how a supply curve is constructed. The above curve represents only a single firm, but you could also replicate that curve for several firms and then add them together to get an industry supply curve.
|