Marginal Cost (MC) & Average Total Cost (ATC)
Total cost is variable cost and fixed cost combined.
TC=VC+FC
Now divide total cost by quantity of output to get average total cost.
ATC=TC/Q
Average total cost can be very handy for firms to compare efficiency at different output or when adjusting different factors of production.
Marginal cost is a concept that's a bit harder for people grasp. The "margin" is the end or the last. The marginal unit is the last unit. Think of marginal cost as the cost of the last unit, or what it costs to produce one more unit. It's hard to find exactly what the cost of the last unit is, but it's not hard to find the average cost of a group of a few more units. To find this, simply take the change in costs from a previous level divided by the change in quantity from the previous level.
MC = Change in TC / Change in Q
Take a look at the table below to see how marginal cost was computed. For example, the marginal cost when the quantity is 56 is $2.82. This was computed by taking TC at 55.90Q ($350) minus TC at 38.16Q ($300) divided by 55.9Q minus 38.16Q (17.74Q).
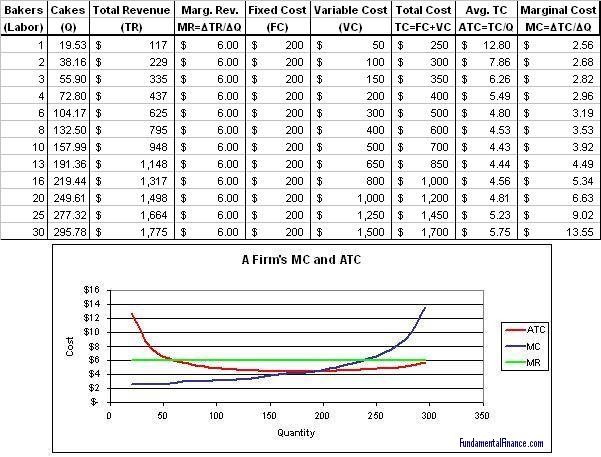
Take a look at the graph. You'll notice that the ATC curve is a U-shape. This is always the case if there are increasing marginal costs. You'll also notice that the MC curve intersects the ATC curve at the ATC curve's minimum point. This will always be the case if there are increasing marginal costs. A helpful way to think of this is to imagine that the MC curve is graphing your semester GPA (grade point average) and that the ATC curve is graphing your cumulative GPA. Perhaps you transfered to a harder school. You previously had a high cumulative GPA but your semester GPA starts to pull it down. As you improve your grades each semester your cumulative and semester GPA will meet. After that, if you continue to improve, your semester GPA will pull up your cumulative GPA again.
In other words, the marginal cost is factored into the average total cost at every unit. Because of fixed cost, marginal cost almost always begins below average total cost. As quantity increases, ATC will decrease and MC will increase. Eventually they intersect, then MC continues to increase and pulls ATC up after it.
A firm's marginal cost curve also acts as its supply curve. Read The Supply Curve article to get a more detailed explaination of why this is so.
|